Published at the owner’s request from the reviewed 27 October analysis. This article was not selected by the automated daily screen. Market data and fiscal periods below remain dated to the original snapshot.
Strong cash generation supports a constructive view, valuation tempers it
AAPL · Research view: Overweight · Horizon: 3m
Source snapshot: 27 Oct 2026, 20:29 UTC. Last completed market session: 2026-10-27.
Apple’s reported quarter showed healthy revenue and earnings growth, while TTM free cash flow and a constructive price trend support the positive case. However, the indicative earnings multiple is demanding, growth is concentrated in iPhone and services, and the supplied DCF is highly assumption-sensitive. Overweight reflects favorable operating evidence balanced against valuation and supply risks; it is not a price target or assurance of near-term performance.
| Metric | Reading | Period | Source |
|---|---|---|---|
| Last closing price | $347.10 | 2026-10-27 | Source |
| Quarterly revenue growth, year over year | +16.36% | 2026-06-27 | Source |
| Quarterly operating margin | 32.62% | 2026-03-29 to 2026-06-27 | Source |
| Indicative earnings multiple | 39.81× | Price 2026-10-27; earnings basis ended 2026-06-27 | Source |
| Cash flow less capital expenditure, trailing twelve months | $136.68B | 2025-06-29 to 2026-06-27 | Source |
What drives the case
In the reported quarter, iPhone was the largest product category and the leading contributor to revenue growth; Services also contributed meaningfully. Mac grew strongly, while iPad declined, a notable offset to broader expansion. Geographically, Europe and Greater China were important contributors, but these geographic and product views partition the same sales and should not be added together. Continued device demand and services monetization support the thesis, while product concentration and component availability constrain it.
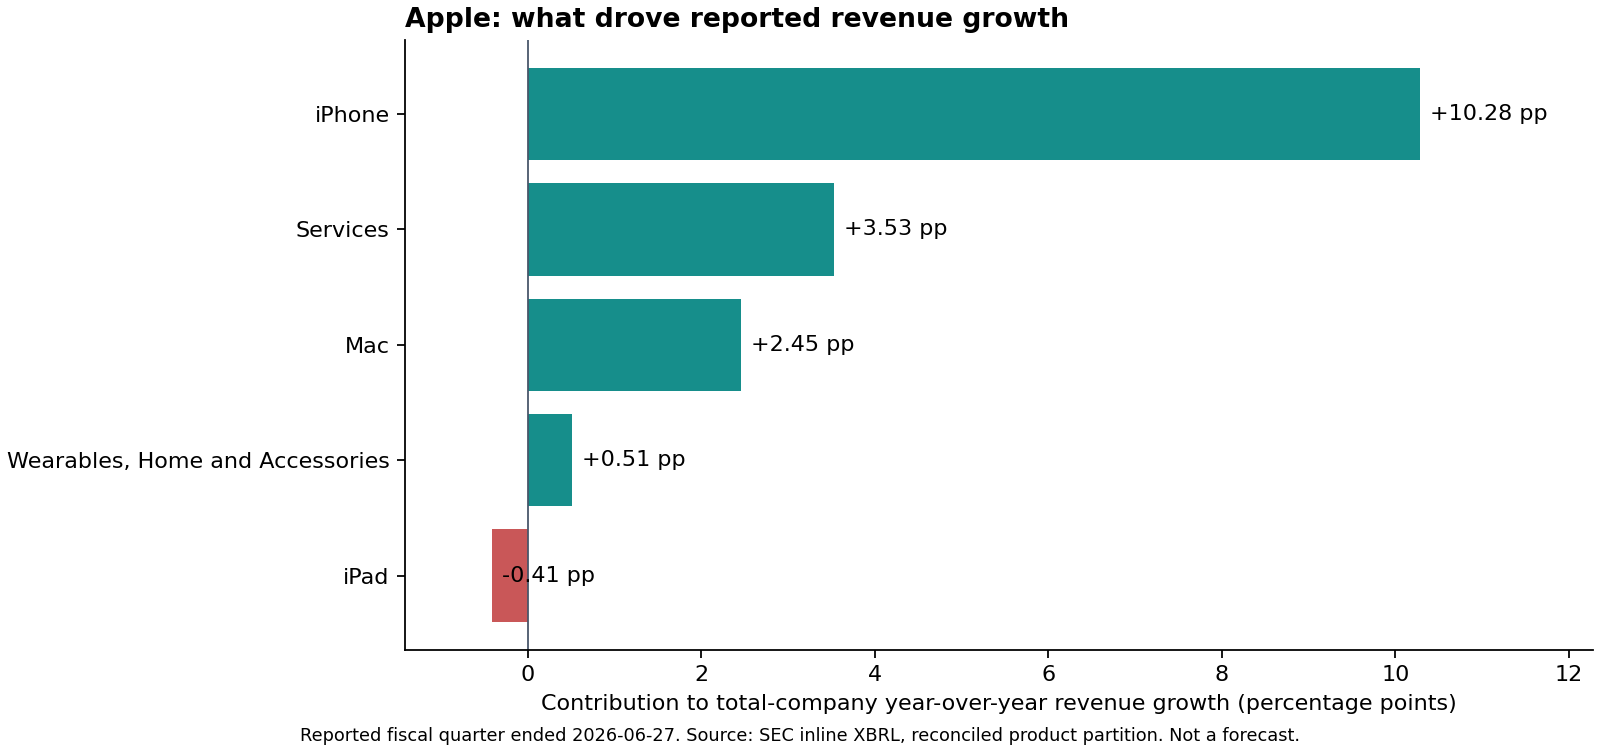
Product Categories
Reported quarter ended 2026-06-27. Contributions are percentage points of total-company revenue growth; these partitions overlap and must not be added.
| Business category | Revenue | Share of revenue | Year-over-year change | Growth contribution |
|---|---|---|---|---|
| iPhone | $54.25B | 49.58% | +21.69% | +10.28 pp |
| Mac | $10.35B | 9.46% | +28.66% | +2.45 pp |
| iPad | $6.19B | 5.66% | -5.93% | -0.41 pp |
| Wearables, Home and Accessories | $7.88B | 7.20% | +6.47% | +0.51 pp |
| Services | $30.74B | 28.09% | +12.09% | +3.53 pp |
Reportable Geographies
Reported quarter ended 2026-06-27. Contributions are percentage points of total-company revenue growth; these partitions overlap and must not be added.
| Business category | Revenue | Share of revenue | Year-over-year change | Growth contribution |
|---|---|---|---|---|
| Americas | $45.78B | 41.84% | +11.12% | +4.87 pp |
| Europe | $29.39B | 26.87% | +22.41% | +5.72 pp |
| Greater China | $18.82B | 17.20% | +22.43% | +3.67 pp |
| Japan | $6.55B | 5.99% | +13.35% | +0.82 pp |
| Rest of Asia Pacific | $8.87B | 8.11% | +15.61% | +1.27 pp |
What the current price implies
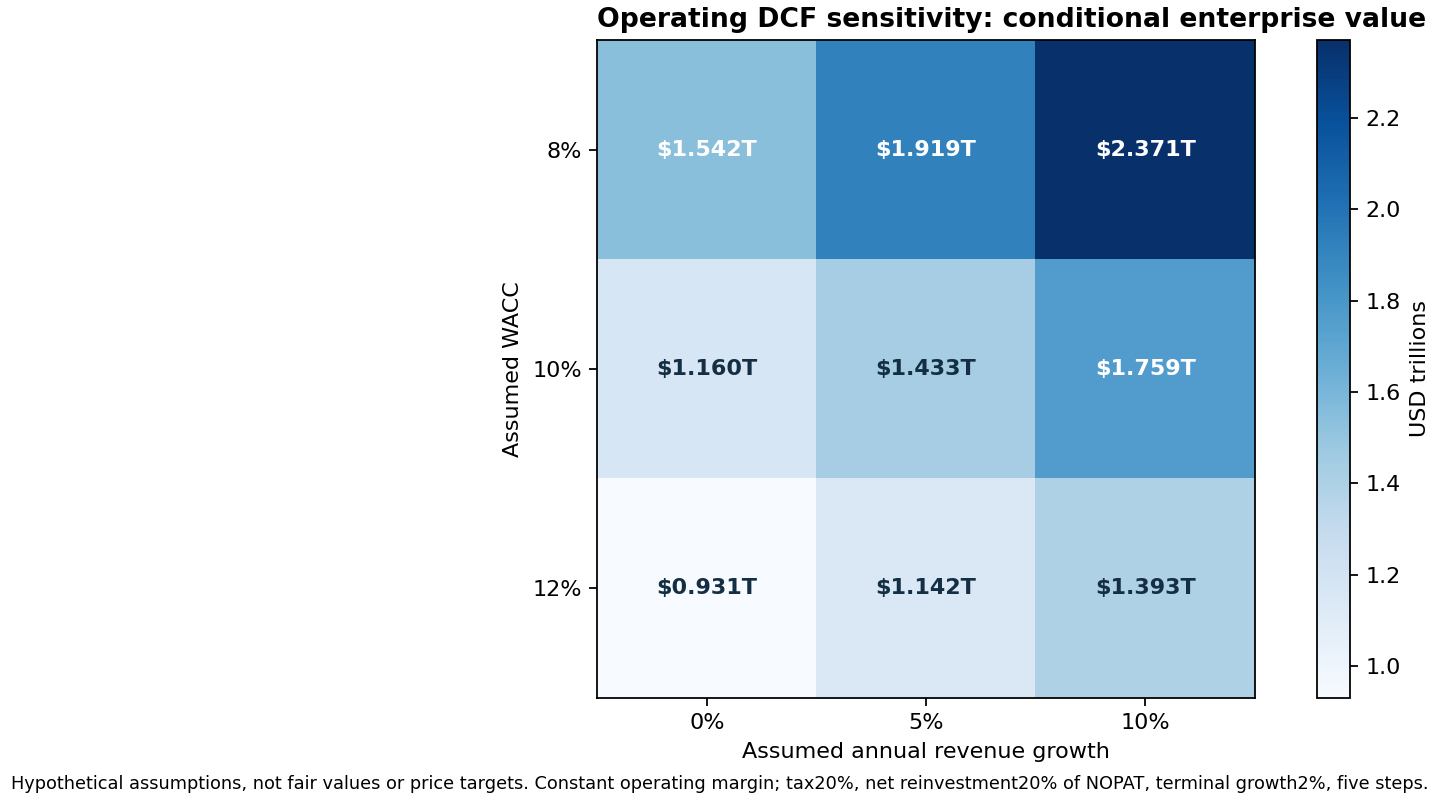
The indicative price-to-arithmetic-TTM-EPS multiple is demanding and offers limited room for disappointment; the EPS bridge is approximate because diluted shares change and reported per-period EPS is rounded, not verified forward EPS. Same-session peer multiples provide context, not a justified fair multiple: fiscal ends differ and operating models are not directly comparable. The hypothetical operating DCF assumes persistent margin, a fixed tax rate, net reinvestment as a share of NOPAT, terminal growth, and varying revenue growth and WACC. Its sensitivity is therefore substantial; terminal value dominates the supplied range. This is not a forecast or fair value, and its partial dated equity bridge omits unreconciled items.
Source 1 Source 2 Source 3 Source 4
Same-session peer context
Fixed diversified platform/technology-company context; operating models and fiscal ends differ. Not a sector census or a fair-multiple recommendation.
All multiples use approximate arithmetic trailing EPS, not forward EPS. Fiscal bases differ; a higher/lower multiple alone does not establish mispricing.
| Company | Price session | Earnings basis ended | Indicative multiple | TTM net margin | CFO / net income |
|---|---|---|---|---|---|
| AAPL | 2026-10-27 | 2026-06-27 | 39.81× | 27.62% | 1.14× |
| MSFT | 2026-10-27 | 2026-06-30 | 29.60× | 40.31% | 1.37× |
| GOOGL | 2026-10-27 | 2026-06-30 | 16.09× | 54.77% | 0.76× |
Earnings quality and cash generation
TTM operating cash flow exceeded net income, and subtracting cash capex leaves substantial free cash flow; matched-period cash conversion is supportive but incorporates working-capital and noncash adjustments. Stock compensation is an expense and a dilution consideration, while buybacks materially return capital and can offset share issuance; neither should be confused with the free-cash-flow definition. The filing attributes improved gross margin partly to product mix and tariff refunds, offset by higher costs, and identifies component constraints. The available excerpt does not quantify normalized earnings effects.
The strongest counter-case
The strongest counterargument is that valuation embeds sustained execution despite reliance on iPhone, while iPad weakness and supply constraints may pressure demand, costs, or margins. The filing notes tariff refunds contributed to reported gross-margin improvement, but the evidence does not establish how persistent that effect is; treating it as either recurring or a one-off would be unsupported. A reversal in growth or margin, product-quality concerns, or a higher required return could compress the multiple. The evidence does not establish future defect incidence or severity.
Events and evidence to watch
The reported quarter is the latest primary operating evidence in this dataset; the next calendar entry is a secondary schedule, not a realized result. Analyst estimates and management outlook are forecasts or claims, not verified outcomes. Subsequent filings can test whether product demand, margins, component availability, and cash generation persist. Secondary news mentions product launches and defect complaints, but their timing, incidence, and earnings impact are not independently established here.
What would change our view
The constructive view would weaken if later reported results show sustained deterioration in revenue, margins, or free cash flow, or if filings confirm worsening supply constraints or material product-quality effects. It would strengthen if subsequent primary disclosures demonstrate durable growth across categories and margins without relying on unquantified adjustments. These are observable conditions, not preset thresholds. The evidence lacks verified forward guidance, defect-impact measurement, a complete equity bridge, and a company-specific historical valuation comparison.
Operating DCF: explicit assumptions, not a price target
Operating margin persists; tax20%, net reinvestment20% of NOPAT, terminal growth2%, five annual periods. Revenue growth and WACC vary. These are analyst scenario inputs, not management guidance, estimated market WACC or calibrated forecasts.
No dynamic margin model, explicit D&A/capex/NWC schedule, acquisitions or calibrated terminal economics. Net reinvestment is an aggregate assumption; no claim of intrinsic fair value or a dated price target.
Historical operating basis: 2025-06-29 to 2026-06-27. This run rate is assumed to apply at the price date; no partial-year/stub-period adjustment is made. Forecast periods below are hypothetical annual steps, not fiscal guidance.
| Assumed annual revenue growth | Assumed WACC | Conditional enterprise value | Terminal share of EV | Partial-bridge value per share |
|---|---|---|---|---|
| 0% | 8% | $1.542T | 74.3% | $102.51 |
| 0% | 10% | $1.160T | 67.6% | $76.36 |
| 0% | 12% | $0.931T | 61.6% | $60.65 |
| 5% | 8% | $1.919T | 76.3% | $128.31 |
| 5% | 10% | $1.433T | 69.9% | $95.05 |
| 5% | 12% | $1.142T | 64.1% | $75.11 |
| 10% | 8% | $2.371T | 77.9% | $159.20 |
| 10% | 10% | $1.759T | 71.8% | $117.35 |
| 10% | 12% | $1.393T | 66.3% | $92.32 |
Partial equity bridge at 2026-06-27: cash $39.54B; reported debt $84.34B; shares 14.609B. Equity proxy = enterprise value + cash − reported debt; divide by that dated share count.
Marketable investments, leases, options, acquisitions and other nonoperating assets/claims are not reconciled. This is not a complete equity valuation.
Illustrative cash-flow path
This displays the assumed middle cell for auditability; it is not a preferred forecast.
| Hypothetical year | Revenue | EBIT | NOPAT | Assumed net reinvestment | FCFF | Discounted FCFF |
|---|---|---|---|---|---|---|
| 1 | $490.16B | $162.60B | $130.08B | $26.02B | $104.07B | $94.60B |
| 2 | $514.67B | $170.73B | $136.59B | $27.32B | $109.27B | $90.30B |
| 3 | $540.41B | $179.27B | $143.41B | $28.68B | $114.73B | $86.20B |
| 4 | $567.43B | $188.23B | $150.59B | $30.12B | $120.47B | $82.28B |
| 5 | $595.80B | $197.64B | $158.11B | $31.62B | $126.49B | $78.54B |
Thesis monitoring checklist
Observed baselines are reference points, not automatic trading triggers.
| What to check | Observed baseline | Direction associated with more risk |
|---|---|---|
| Does earnings growth justify the current indicative multiple? | 39.81× | higher |
| Does trailing free cash flow remain robust? | $136.68B | lower |
| Do component constraints or costs worsen materially? | New disclosure; no numeric threshold | new disclosure |
Sources and scope
AI-assisted research using published financial evidence and labelled observed market/provider context. Indicative EPS valuation is arithmetic and approximate. Schedules and forecasts are not reported outcomes. Sensitivities are hypothetical, not price targets. The structured report retains the full evidence and missing dimensions.